| Scope of Consolidation |
| Yamato’s consolidated financial statements include the accounts of 17 consolidated subsidiaries and 3 affiliates accounted for by the equity method. The number of consolidated subsidiaries and affiliates increased by 1 each compared with the previous fiscal year with the addition of Yamato UPS International Air Cargo Co., Ltd. and UPS Yamato Express Co., Ltd. | |||||
| Results of Operations |
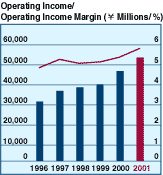
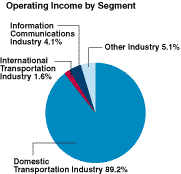
| Operating Income For the fiscal year ended March 31, 2001, consolidated operating revenues rose 11.6% to ¥906,944 million (US$7,314.1 million). This was partly the result of the Company’s efforts to raise the quality of its existing products, increase customer convenience, strengthen logistics operations, and expand transactions with corporate customers. Operating costs increased 11.2% to ¥838,219 million (US$6,759.8 million), and selling, general and administrative expenses advanced 15.7% to ¥16,699 million (US$134.7 million). Consequently, the ratio of total operating costs and expenses to operating revenues edged down 0.3 percentage point from the previous fiscal year to 94.3%, and operating income advanced 17.6% to ¥52,026 million (US$419.6 million). The consolidated operating income margin was 5.74%, compared with 5.45% in the previous term. The higher consolidated operating income margin reflects high value-added businesses conducted by Group companies utilizing such management resources as the distribution network of Yamato Transport. By segment, efforts in the domestic transportation industry to improve customer convenience through greater Internet services and quality-centered service differentiation, despite a continuing severe operating environment from price competition resulted in a 5.4% increase in operating revenues to ¥802,505 million (US$6,471.8 million). In the international transportation industry, although international transactions declined due to the withdrawal of financial institutions from overseas businesses, the commencement of airfreight operations in the United States, upgrades to distribution bases in Europe, and strong performance in Southeast Asia had a positive impact. As a result, operating revenues from the international transportation industry soared 236.4% to ¥67,568 million (US$544.9 million). In the information communications industry, acceleration of host computers, creation of more open architecture, greater reliance on IT in communications networks, and expansion of marketing capabilities resulted in a 7.6% advance in operating revenues to ¥19,425 million (US$156.7 million). In the other industry, firm demand for packaging operations, strong sales of books in marketing operations contributed to a rise in operating revenues of 32.4% to ¥17,446 million (US$140.7 million). |
|||||
 |
 |
| Net Income Interest expense dropped 22.4% to ¥2,582 million (US$20.8 million), and interest and dividend income increased 18.9% to ¥1,036 million (US$8.4 million). Other expenses—net of ¥55,580 million (US$448.2 million) was recorded, compared with ¥6,911 million in the previous term, largely as a result of provision for retirement benefits of ¥47,963 million (US$386.8 million). Owing to the above factors, the Company posted a loss before income taxes and minority interest of ¥3,554 million (US$28.7 million), as opposed to income before income taxes and minority interest of ¥37,339 million in the previous term. Income taxes of ¥484 million (US$3.9 million) resulted in a net loss of ¥4,181 million (US$33.7 million), compared with net income of ¥20,418 million in the previous term. Net loss per share was ¥9.25 (US$0.07), compared with net income per share of ¥46.11 in the previous term. Return on operating revenues was negative 0.46%. |
|||||
   |
| Liquidity and Financial Resources |
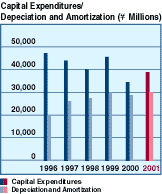
| Cash Flows Net cash provided by operating activities totaled ¥55,249 million (US$445.6 million). Depreciation and amortization was ¥29,900 million (US$241.1 million), and increase in notes and accounts receivable was ¥17,567 million (US$141.7 million). Increase in liability for employees’ retirement benefits of ¥56,788 million (US$458.0 million) was able to partially offset a loss before income taxes and minority interest. Net cash used in investing activities was ¥32,931 million (US$265.6 million). The main uses of cash were purchases of property, plant and equipment of ¥38,190 million (US$308.0 million) and purchases of marketable and investment securities of ¥15,896 million (US$128.2 million). Net cash used in financing activities totaled ¥33,374 million (US$269.1 million). The principal uses of cash were repayments of long-term debt of ¥29,505 million (US$237.9 million) and dividends paid of ¥6,249 million (US$50.4 million). In aggregate, cash and cash equivalents, end of year, edged down to ¥158,899 million (US$1,281.4 million). |
|||||
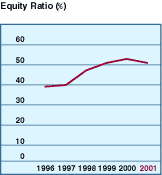
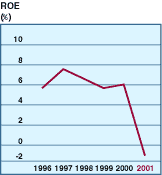
| Financial Position Owing primarily to notes and accounts receivable—trade of ¥80,586 million (US$649.9 million), total current assets edged up 0.7% to ¥265,650 million (US$2,142.3 million). Total current liabilities decreased 8.8% to ¥172,116 million (US$1,388.0 million) chiefly on the back of a 57.3% decline in current portion of long-term debt to ¥17,629 million (US$142.2 million). Net property, plant and equipment edged up 1.4% to ¥316,100 million (US$2,549.2 million). Total investments and other assets surged 32.3% to ¥88,496 million (US$713.7 million). Total assets increased 4.3% to ¥670,246 million (US$5,405.2 million), fueled by ¥22,878 million jump in deferred tax assets to ¥24,150 million (US$194.8 million). Interest-bearing debt (the sum of short-term bank loans, the current portion of long-term debt and long-term debt) fell 26.9% to ¥114,957 million (US$927.1 million). The interest coverage ratio (operating income plus interest and dividend income divided by interest expense) improved 7.0 times to 20.6 times. Total shareholders’ equity edged up 1.7% to ¥344,209 million (US$2,775.9 million) and total assets increased 4.3% to ¥670,246 million (US$5,405.2 million). Shareholders’ equity as a percentage of total assets declined 1.3 percentage points to 51.4%. Return on average assets was negative 0.64% and return on average shareholders’ equity was negative1.23%. |
|||||
 |
 |
 |