Resource Conservation & Waste ~Promote Resource Conservation and Reduce Waste~
- Targets and results
- Sustainable Use of Resources
- Performance Data
- Initiatives to Reduce Environmental Impact
- Case Study 1 : Collaborative programs with manufacturers on recycling and reuse of waste tires
- Case Study 2 : Green purchasing of uniforms and collaboration with other companies related to recycling
- Case Study 3 : Provision of confidential document recycling services
- Case Study 4 : Supporting reuse of used school uniforms
- Case Study 5 : Initiatives in Collaboration with Local Communities
In Resource Conservation & Waste - one of its materialities - the Yamato Group is working to protect the environment based on its environmental policy, to drastically reduce environmental burden, and promote the use of technology and create opportunities for minimizing environmental impact.
Targets and results
| Materiality | FY2023 Targets | FY2023 Results | |||
|---|---|---|---|---|---|
| Resource Conservation & Waste | |||||
| Promote Resource Conservation and Reduce Waste | Use 55% renewable resources and recycled materials for paper materials*7 | Used 64% renewable resources and recycled materials for paper materials | |||
| Reduce landfill disposal rate (final disposal rate) to 5% or less*8 | The landfill disposal rate (final disposal rate) was 5% | ||||
| Provide products utilizing recycled materials and resource-saving materials | Created improved samples for three products Completed calculation of paper and film reduction volume |
||||
| Reduce use of resources, reduce waste, and recycle | Reduce landfill waste volume (final disposal volume) 40% compared to fiscal 2020 | The amount of paper used decreased 17% compared to fiscal 2021 | |||
| Reduce landfill waste volume (final disposal volume) by 3% compared to fiscal 2020 | Landfill waste volume (final disposal volume) decreased 55% compared to fiscal 2020 | ||||
| Reduce waste intensity by 3% compared to fiscal 2020 | Waste volume intensity was reduced 13.8% compared to fiscal 2020 | ||||
| Raise recycling rate to over 80% | Recycling rate 84% | ||||
| Reduce amount of resources used; Reduce waste volume; and Promote recycling*9 | Reduced packaging materials in forwarding operations at some overseas local subsidiaries | ||||
| Use renewable resources, recycled materials, and less plastic | Use 30% renewable resources/recycled materials for containers/packaging materials*10 | Used 34% renewable resources and recycled materials for containers/packaging materials | |||
| Promote the use of recycled materials for packaging*9*11 | Started use of shrink-wrap with 50% reduction in volume at overseas relocation business | ||||
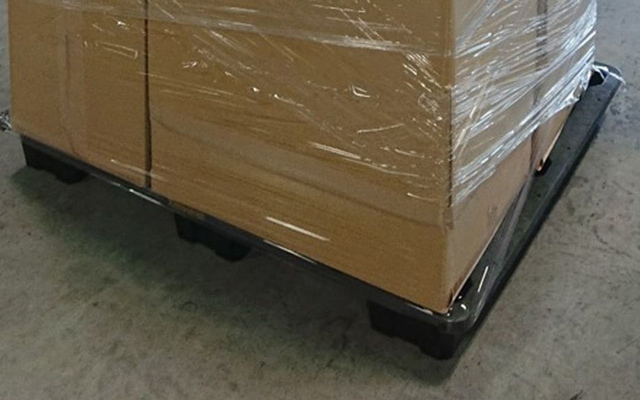
| Develop reusable materials and provide framework for material sharing usage*12 | Promote the practical application of materials for reuse and provide transportation with shared reusable materials | Transitioned wooden pallets to returnable pallets (containers) in packing business 20% reduction in waste pallets |
|||
| Launch a model for sharing reusable things and expand user base | Reduced packaging material usage in packing business by transition to use of common materials | ||||
| Reduce water usage and improve water quality | Reduce water intensity by 3% compared to fiscal 2020 | Water intensity was reduced 8.7% compared to fiscal 2020 | |||
| Advance water reuse and water quality conservation | Continued use of soap with low environmental impact | ||||
| Advance activities to reduce volume of water used*10 | Collected performance data and good examples from overseas local subsidiaries | ||||
- Please use the scroll bar to see the rest of the table.
*7 Paper material refers to cardboard for shipping, pickup and delivery materials, etc.
*8 Equivalent to reduction by half compared to the past.
*9 Overseas. All other items in Japan.
*10 Containers/packaging materials includes packaging used for shipping and cushioning materials.
*11 Overseas logistics/moving-related services.
*12 External collaboration.


For more targets, please refer to the Sustainable Strategies, Goals, and Results.
Sustainable Use of Resources
The Yamato Group promotes green purchasing and recycling, engages in the development of environmentally-friendly packaging and other materials, and strives to conserve resources.
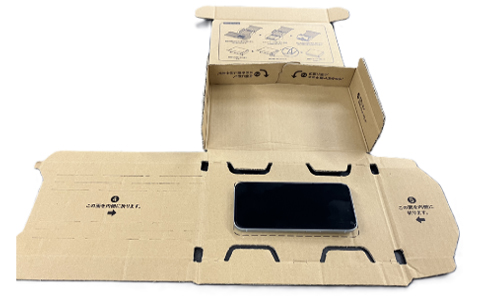
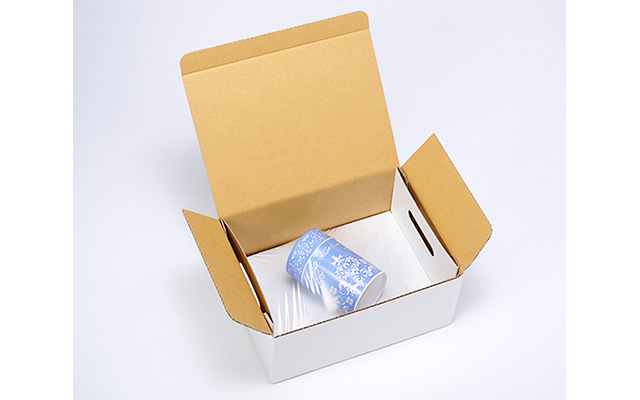
We are contributing to the creation of a circular economy by recycling uniforms and waste tires after use, researching and developing packaging materials that do not require cushioning materials or are easy to sort and separate, and providing overseas relocation support services with packaging that uses recycled materials. The Group is committed to ensuring sustainable production and consumption patterns in accordance with Goal 12 of the Sustainable Development Goals (SDGs).
Performance Data
| Item | Details | FY2019 | FY2020 | FY2021 | FY2022 | FY2023 | ||||||||||
|---|---|---|---|---|---|---|---|---|---|---|---|---|---|---|---|---|
| Input volume (t) | Recycled input materials (t) | Percentage of recycled input materials (%) | Input volume (t) | Recycled input materials (t) | Percentage of recycled input materials (%) | Input volume (t) | Recycled input materials (t) | Percentage of recycled input materials (%) | Input volume (t) | Recycled input materials (t) | Percentage of recycled input materials (%) | Input volume (t) | Recycled input materials (t) | Percentage of recycled input materials (%) | ||
| Raw materials | Wood, plywood, etc. | 0 | 0 | 0 | 0 | 0 | 0 | 1,013 | 0 | 0 | 0 | 0 | 0 | 0 | 0 | 0 |
| Chemicals | Paint, etc. | 0.1 | - | - | 0.1 | - | - | 0.0 | - | - | 0.0 | - | - | 0.0 | 0.0 | - |
| Auto parts | Vehicle parts | 4 | 0 | 0 | 3 | 0 | 0 | 0 | 0 | - | 0 | 0 | - | 0 | 0 | - |
| Vehicle tyres and tyre tubes | 4,391 | 32 | 1 | 3,709 | 13 | 0 | 3,416 | 6 | 0 | 3,663 | 440 | 12 | 4,065 | 611 | 15 | |
| Vehicles | Car bodies | 18,123 | 33 | 0 | 15,310 | 0 | 0 | 21,379 | 0 | 0 | 6,997 | 0 | 0 | 9,544 | 8 | 0 |
| Sorting equipment | Automatic sorters, belt conveyors | 280 | 0 | 0 | 102 | 0 | 0 | 311 | 1 | 0 | 231 | 0 | 0 | 92 | 0 | 0 |
| Tools and equipment | Roll box pallettes, cold boxes, etc. | 3,235 | 0 | 0 | 4,392 | 0 | 0 | 7,186 | 0 | 0 | 1,359 | 0 | 0 | 10,187 | 0 | 0 |
| Pick-up and delivery equipment | Bags for temperature-controlled deliveries | 116 | 0 | 0 | 125 | 0 | 0 | 131 | 0 | 0 | 109 | 0 | 0 | 149 | 0 | 0 |
| Paper material | Slips | 6,910 | 0 | 0 | 9,084 | 0 | 0 | 9,941 | 0 | 0 | 8,346 | 0.5 | 0 | 7,409 | 0 | 0 |
| Copy paper | 3,208 | 703 | 22 | 2,701 | 596 | 22 | 3,084 | 1,057 | 34 | 2,905 | 1,876 | 64.6 | 2,516 | 1,691 | 67 | |
| Cardboard boxes for packing | 7,526 | 6,580 | 87 | 15,352 | 12,196 | 79 | 26,251 | 20,411 | 78 | 24,933 | 22,047 | 88.4 | 22,448 | 20,313 | 90 | |
| Material for pick-up and delivery (delivery notices, PP roll paper, etc.) | 2,326 | 0 | 0 | 1,648 | 0 | 0 | 2,123 | 1 | 0 | 2,111 | 0 | 0 | 2,143 | 0 | 0 | |
| Paper materials total | 19,970 | 7,283 | 36 | 28,785 | 12,793 | 44 | 41,399 | 21,468 | 52 | 38,295 | 23,924 | 62.5 | 34,516 | 22,004 | 64 | |
| Containers and packaging material | Packaging material | 2,443 | 7 | 0 | 4,311 | 1,427 | 33 | 3,790 | 1,317 | 35 | 4,043 | 1,275 | 31.5 | 3,347 | 1,146 | 34 |
| Cushioning material | 1,736 | 1,207 | 70 | 1,060 | 259 | 24 | 1,063 | 164 | 15 | 844 | 191 | 22.6 | 796 | 267 | 33 | |
| Bento lunch box containers and bread packaging bags * | - | - | - | 2 | 0 | 0 | 2 | 0 | 0 | 1 | 0 | 0 | 1 | 0 | 0 | |
| Containers and packaging materials total | 4,179 | 1,214 | 29 | 5,372 | 1,686 | 31 | 4,855 | 1,482 | 31 | 4,888 | 1,466 | 30.0 | 4,144 | 1,412 | 34 | |
- Please use the scroll bar to see the rest of the table.
- Boundary: Consolidated Group companies in Japan, and Swan Co., Ltd.
- The breakdown may not add up to the total due to rounding.
- *Used at Swan Co., Ltd. Data tabulated since fiscal 2020.
| Item | Details | FY2019 | FY2020 | FY2021 | FY2022 | FY2023 |
|---|---|---|---|---|---|---|
| Furniture | Beds, tables, chairs, etc. | 0 | 0 | 0 | 0 | 0 |
| Packaging material | Styrofoam | 105 | 57 | 36 | 0.7 | 0.8 |
- Boundary: Consolidated Group companies in Japan, and Swan Co., Ltd.
| Item | FY2019 | FY2020 | FY2021 | FY2022 | FY2023 |
|---|---|---|---|---|---|
| Surface water (1,000m3) | 0 | 3 | 13 | 11 | 12 |
| Ground water (1,000m3) | 0 | 9 | 8 | 0 | 0 |
| Rain water (1,000m3) | 0 | 0 | 0 | 0 | 0 |
| Tap water (1,000m3) | 1,787 | 1,679 | 1,809 | 1,553 | 1,479 |
| Total (1,000m3) | 1,787 | 1,691 | 1,831 | 1,564 | 1,491 |
| Reused water (1,000m3) | 1 | 5 | 3 | 3 | 3 |
| Water reuse ratio (%) | 0 | 0 | 0 | 0 | 0 |
| Water consumption intensity (1,000m3 / 100 million yen of operating revenues) |
0.0941 | 0.0855 | 0.0927 | 0.0799 | 0.0781 |
- Boundary: Consolidated Group companies in Japan, and Swan Co., Ltd.
- The breakdown may not add up to the total due to rounding.
| Fiscal year | Item | Hazardous waste (t) | Non-hazardous waste (t) | Total (t) | Percent (%) | Waste volume intensity (t/100 million yen of operating revenues) |
|---|---|---|---|---|---|---|
| FY2019 | Generated volume | 8 | 55,272 | 55,280 | 100 | 2.91 |
| Recycled volume | 4 | 30,478 | 30,481 | 55 | - | |
| Collected volume | 0 | 4,703 | 4,703 | 9 | ||
| Incinerated volume | 4 | 13,501 | 13,505 | 24 | ||
| Final disposal volume | 1 | 6,590 | 6,590 | 12 | ||
| FY2020 | Generated volume | 10 | 48,346 | 48,357 | 100 | 2.45 |
| Recycled volume | 1 | 22,889 | 22,889 | 47 | - | |
| Collected volume | 0 | 4,752 | 4,752 | 10 | ||
| Incinerated volume | 6 | 15,801 | 15,807 | 33 | ||
| Final disposal volume | 3 | 4,905 | 4,908 | 10 | ||
| FY2021 | Generated volume | 16 | 47,775 | 47,791 | 100 | 2.42 |
| Recycled volume | 5 | 21,346 | 21,351 | 45 | - | |
| Collected volume | 0 | 4,637 | 4,637 | 10 | ||
| Incinerated volume | 9 | 16,763 | 16,772 | 35 | ||
| Final disposed volume (landfill) | 1 | 5,030 | 5,031 | 10 | ||
| FY2022 | Generated volume | 12 | 40,259 | 40,271 | 100 | 2.06 |
| Recycled volume | 4 | 18,991 | 18,996 | 48 | - | |
| Collected volume | 1 | 6,958 | 6,959 | 17 | ||
| Incinerated volume | 6 | 11,024 | 11,030 | 28 | ||
| Final disposal volume | 1 | 2,956 | 2,957 | 7 | ||
| FY2023 | Generated volume | 13 | 41,261 | 41,274 | 100 | 2.11 |
| Recycled volume | 4 | 22,949 | 22,953 | 56 | - | |
| Collected volume | 1 | 11,673 | 11,674 | 28 | ||
| Incinerated volume | 6 | 4,354 | 4,360 | 11 | ||
| Final disposal volume | 2 | 2,215 | 2,216 | 5 |
- Please use the scroll bar to see the rest of the table.
- Boundary: Consolidated Group companies in Japan, and Swan Co., Ltd.
- Hazardous waste refers to "Specially managed waste", designated by Japan's Waste Disposal Law.
- Non-hazardous waste refers to other waste (industrial waste other than Specially managed waste, general waste, valuables).
- The breakdown may not add up to the total due to rounding
| FY2019 | FY2020 | FY2021 | FY2022 | FY2023 |
|---|---|---|---|---|
| 0 | 0 | 0 | 0 | 0 |
- Boundary: Consolidated Group companies in Japan, and Swan Co., Ltd.
Other fuel and emissions data
Initiatives to Reduce Environmental Impact
Case Study 1 : Collaborative programs with manufacturers on recycling and reuse of waste tires
Tires are an indispensable vehicle part for the Yamato Group, which is primarily engaged in the transportation industry. At the same time, they are also consumables. Therefore, it is necessary to give consideration to their environmental impact as we promote our business.
The Group is promoting collaborative programs on tire reuse and recycling with Bridgestone BRM Co., Ltd. and Toko Tire Industrial Co., Ltd. Waste tires are processed by our partners, including washing, repairing, shaping, and pressure testing, to be remade into retread tires. Retread tires can be made using less than one third of the raw materials required to make a new tire, and also help to reduce tire production and disposal by extending the usage period for tires.
In fiscal 2023, the number of retread tires procured by Yamato Auto Works Co., Ltd. and purchased by Yamato Transport grew to 34,574 (up 131% year on year) as we continue to expand the use of retread tires.
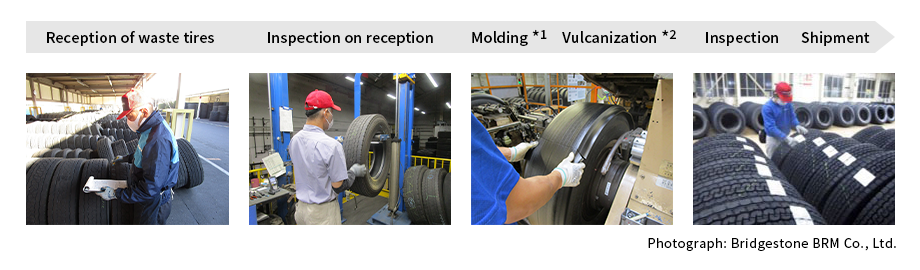
*1 Tread rubber is affixed in the molding process
*2 Vulcanization is a process to ensure elasticity and strength when processing rubber by applying pressure and heat
Case Study 2 : Green purchasing of uniforms and collaboration with other companies related to recycling
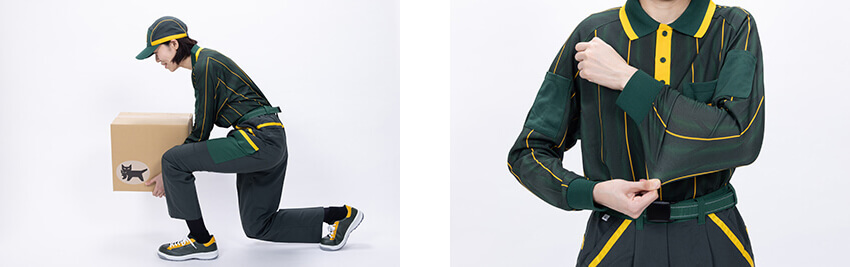
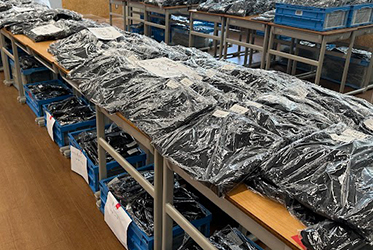
In 2000, the Yamato Group introduced uniforms made from recycled materials, for the purpose of protecting the natural environment and reusing resources. In order to minimize the environmental impact of uniforms after their use, the Group outsources recycling operations to A·K·TECH Co., Ltd., which specializes in recycling used clothing. Uniforms are converted into felt, and reused mainly as sound absorbent materials for automotive applications. The amount of uniforms recycled in fiscal 2023 will be approximately 162tons, contributing to a reduction in waste generated and plastic resources required for production.
Case Study 3 : Provision of confidential document recycling services
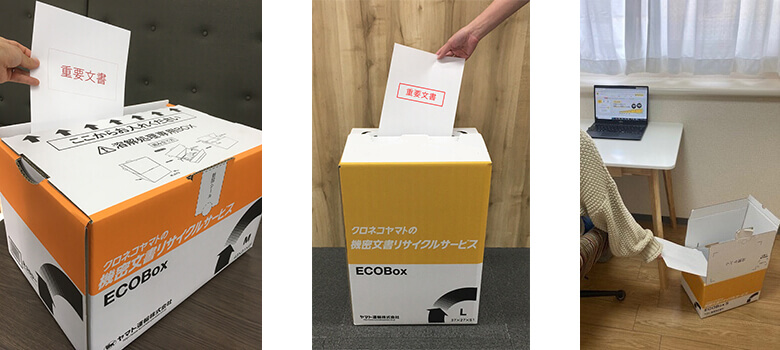
Yamato Transport Co., Ltd. offers a confidential document recycling service that enables easy and safe disposal of confidential documents simply by placing them in a dedicated box. Since the unopened boxes are dissolved, there is no need to worry about information leakage. After dissolving, 100% of the material is reused as toilet paper and cardboard.
In fiscal 2023, around 21,308 tons of confidential documents were dissolved and recycled nationwide.
Case Study 4 : Supporting reuse of used school uniforms
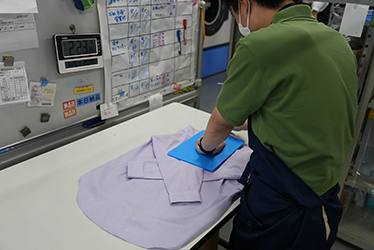
The Yamato Group provides comprehensive support for school uniform reuse programs run by some schools. Unneeded school uniforms collected from families go through a process at Swan Kosha (Yamato Self-Support Center)*1 involving inspection, cleaning, measurement, packaging, and label attachment. Yamato Transport delivers the uniforms from storage to the reuse event held at the school.
By making it easy for those donating the uniforms, the number of collections increases, promoting reuse. We also reduce the burden on the program operators by handling all processes after collection, while contributing to resource recycling.

*1 Swan Kosha is operated by Social Welfare Corporation Yamato Jiritsu Center. Yamato Jiritsu Center is a worksite that conducts training for people with disabilities to enable them to work independently. Student uniforms are used as training materials to support trainees in finding employment.
Case Study 5 : Initiatives in Collaboration with Local Communities
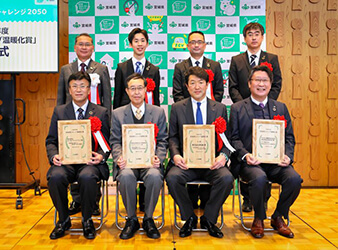
As a result of developing initiatives to actively reduce our environmental burden at the Yamato Transport Shin-Miyagi Regional Branch Office, we won the 2022 Miyagi Prefecture Stop Global Warming Award (currently Miyagi Zero Carbon Award)*1.
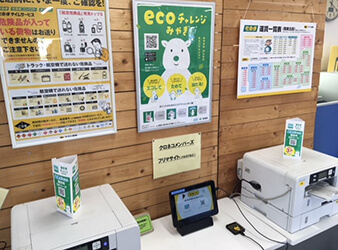
At this regional branch office, we advance public awareness for employees by regularly confirming initiatives, sharing information, and issuing a newsletter with details of initiatives. We are making efforts with our own originality and creativity, such as increasing the recycling rate by sorting and collecting waste paper and plastic and introducing label-free beverages at sales offices. In areas related to transportation, invoice issuing through Nekopit*2 , which encourages the use of invoices that utilize paper materials with a high recycling rate, and pick-up and delivery of parcels through PUDO*3, which are expected to reduce GHG emissions by reducing the number of redeliveries, were added as eco actions to Eco Challenge Miyagi*4, Miyagi Prefecture’s app to encourage environmentally friendly actions from July 2023.
*1 A system led by Miyagi Prefecture commending organizations for remarkable achievements in their initiatives that contribute to global warming countermeasures
*2 Devices installed at sales offices
*3 Open-type parcel lockers
*4 An app that awards points for participation in environmental actions (eco actions) provided by Miyagi Prefecture