ESG Data
Human Resources Data
| Item | Details | FY2019 | FY2020 | FY2021 | FY2022 | FY2023 | Scope |
|---|---|---|---|---|---|---|---|
| Number of employees | Total | 224,945 | 223,191 | 216,803 | 210,197 | 177,430 | Consolidated Group (worldwide) |
| Male | 144,610 | 143,155 | 139,143 | 135,834 | 117,651 | ||
| Female | 80,335 | 80,036 | 77,700 | 74,363 | 59,779 | ||
| Out of which, employees in overseas offices | Total | 2,089 | 1,474 | 1,429 | 1,456 | 1,265 | Consolidated Group companies (overseas) *1 |
| Male | 1,327 | 809 | 775 | 773 | 703 | ||
| Female | 762 | 665 | 654 | 683 | 562 | ||
| Employment type | Full timers | 98,744 | 96,829 | 94,402 | 92,727 | 88,917 | Consolidated Group (worldwide) |
| Part timers | 126,201 | 126,362 | 122,401 | 117,470 | 88,513 | ||
| Average age | Total | 41.8 | 42.4 | 42.9 | 43.4 | 45 | Consolidated Group companies in Japan and Swan Co., Ltd. (Full timers) |
| Male | 41.9 | 42.5 | 43 | 43.5 | 45 | ||
| Female | 41.1 | 41.6 | 42.3 | 43 | 44.9 | ||
| Average number of years of employement | Total | 10.7 | 11.2 | 11.8 | 12.3 | 16.2 | Consolidated Group companies in Japan and Swan Co., Ltd. (Full timers) |
| Male | 11.3 | 11.8 | 12.4 | 13 | 16.3 | ||
| Female | 6.6 | 6.7 | 7 | 7.6 | 15.3 | ||
| Number of managers | Total | 6,543 | 6,612 | 6,509 | 6,594 | 6,099 | Consolidated Group companies in Japan and Swan Co., Ltd. *2 |
| Male | 6,207 | 6,276 | 6,161 | 6,209 | 5,737 | ||
| Female | 336 | 336 | 348 | 369 | 362 | ||
| Female managers(%) | 5.1 | 5.1 | 5.6 | 5.7 | 5.9 | ||
| Number of new employee hires | Total | 826 | 774 | 424 | 527 | 540 | Consolidated Group companies in Japan and Swan Co., Ltd. |
| Male | 494 | 473 | 329 | 407 | 438 | ||
| Female | 332 | 301 | 95 | 120 | 102 | ||
| Percentage of mid-career employees | - | - | 84.7 | 76.3 | 66.2 | Consolidated Group companies in Japan and Swan Co., Ltd. | |
| Number of local hires in overseas offices *3 | 2,018 | 1,426 | 1,390 | 1,441 | 1,719 | Consolidated Group companies (overseas) *1 | |
| Turnover rate(%) | Voluntary | 3.9 | 2.8 | 2.7 | 3.1 | 4.0 | Consolidated Group companies in Japan and Swan Co., Ltd. (Full timers) |
| Overall turnover rate | - | - | 3.6 | 4.5 | 6.1 | ||
| Number and percentage of disabled employees | Number of employees | 2,718 | 2,632 | 2,829 | 2,951 | 2,873 | Consolidated Group companies in Japan and Swan Co., Ltd. |
| Percentage | 2.23 | 2.36 | 2.62 | 2.85 | 3.14 | ||
| Number of labor union members | - | - | 79,726 | 79,095 | 76,509 | Yamato Transport Co., Ltd. (Full timers) | |
| Operating revenue per employee (thousand yen) | - | 11,633 | 12,550 | 12,938 | 13,532 | Consolidated Group companies in Japan | |
| Gender wage gap (%) | - | - | - | 76.7 | 73.9 | Consolidated Group companies in Japan | |
| Rate of reduction in overtime hours per employee (compared with FY2020) | - | - | 11.4 | 7.0 | 7.2 | Consolidated Group companies in Japan | |
| Expenses to develop talent of employees (JPY MM) | 549 | 224 *4 | 310 | 112 *4 | 341 | Yamato Holdings Co., Ltd. and Yamato Transport Co., Ltd. | |
| Number of days of training spent on employee talent development | 5.5 | 3 | 2.5 | 1.2 *4 | 1.1 | Yamato Transport Co., Ltd. (managers) | |
*1 "Consolidated Group companies (overseas)" includes Yamato (China) Transport, Yamato Transport USA, Yamato Europe, Yamato International Logistics, Yamato Logistics (Hong Kong), Taiwan Yamato Intl. Logistics, Yamato Transport Singapore, Yamato Transport Malaysia, Yamato Management (China), Yamato Hong Kong and Yamato Asia
*2 Data up to FY2022, is for domestic and overseas consolidated companies
*3 Cumulative number of full and part time hires, including locally-hired Japanese individuals
*4 Training was conducted online due to the impact of the COVID-19 pandemic.
| Item | Details | FY2019 | FY2020 | FY2021 | FY2022 | FY2023 | Scope | |
|---|---|---|---|---|---|---|---|---|
| Employee Awareness Survey | Response rate | 82.6 | 74.3 | 83.7 | 85.6 | 84.9 | Consolidated Group companies in Japan and Swan Co., Ltd. | |
| Rate of respecting diversity (%) | 65.8 | 70.0 | 82.7 | 82.6 | 79.9 | |||
| Rate of fairness and equality (average score out of 5) | Male | 4.14 | 3.90 | 3.81 | 3.77 | 3.89 | ||
| Female | 3.93 | 3.75 | 3.66 | 3.59 | 3.79 | |||
| Rate of contribution (average score out of 5) | Male | 4.11 | 4.05 | 3.94 | 3.90 | 3.85 | ||
| Female | 3.99 | 3.93 | 3.85 | 3.81 | 3.77 | |||
| Total satisfaction in workplace comfort (average score out of 5) | Male | 3.93 | 3.94 | 3.84 | 3.80 | 3.79 | ||
| Female | 3.99 | 3.88 | 3.80 | 3.74 | 3.75 | |||
| Total satisfaction in workplace motivation (average score out of 5) | Male | 3.89 | 3.88 | 3.75 | 3.72 | 3.68 | ||
| Female | 3.90 | 3.84 | 3.75 | 3.69 | 3.66 | |||
| Item | Details | FY2019 | FY2020 | FY2021 | FY2022 | FY2023 | Scope |
|---|---|---|---|---|---|---|---|
| Number of employees who took childcare leave | Total | 894 | 1,134 | 1,200 | 846 | 994 | Consolidated Group companies in Japan and Swan Co., Ltd. |
| Male | 60 | 113 | 183 | 326 | 495 | ||
| Female | 834 | 1,021 | 1,017 | 520 | 499 | ||
| Number of employees taking childcare leave (%) | Total | - | - | - | 30.4 | 41.0 | Consolidated Group companies in Japan and Swan Co., Ltd. |
| Male | - | - | - | 13.8 | 25.0 | ||
| Female | - | - | - | 123.2 | 132.0 | ||
| Number of employees who chose short-time working for childcare | Total | 717 | 878 | 962 | 920 | 850 | Consolidated Group companies in Japan and Swan Co., Ltd. |
| Male | 31 | 45 | 44 | 55 | 31 | ||
| Female | 686 | 833 | 918 | 865 | 819 | ||
| Number of employees who took nursing care leave | Total | 33 | 70 | 66 | 87 | 95 | Consolidated Group companies in Japan and Swan Co., Ltd. |
| Male | 12 | 28 | 27 | 41 | 39 | ||
| Female | 21 | 42 | 39 | 46 | 56 | ||
| Number of employees who chose short-time working for nursing care | Total | 64 | 88 | 96 | 94 | 85 | Consolidated Group companies in Japan and Swan Co., Ltd. |
| Male | 39 | 53 | 55 | 53 | 39 | ||
| Female | 25 | 35 | 41 | 41 | 46 | ||
| Annual paid leave utilization | Average number of days | 16.7 | 16.8 | 17.4 | 18.8 | 19.3 | Consolidated Group companies in Japan and Swan Co., Ltd. |
| Utilization rate | 89.1 | 90.0 | 91.8 | 98.1 | 89.4 |
| Item | Details | FY2019 | FY2020 | FY2021 | FY2022 | FY2023 | Scope |
|---|---|---|---|---|---|---|---|
| Number of serious occupational diseases *1 | 0 | 0 | 0 | 0 | 1 | Consolidated Group companies in Japan and Swan Co., Ltd. | |
| Ratio of frequency of lost workday injuries *2 | 5.25 | 5.47 | 5.75 | 6.12 | 5.48 | Consolidated Group companies in Japan and Swan Co., Ltd. | |
| Employees taking stress checks | Number of employees | 126,345 | 125,535 | 120,500 | 119,263 | 113,311 | Consolidated Group companies in Japan and Swan Co., Ltd. |
| Percentage | 95.2 | 94.9 | 96.1 | 98.3 | 98 | ||
| Ratio of employees taking specific health checkups *3 | Employees only | 98.1 | 98.8 | 99.2 | 98.9 | 98.8 | Companies/offices subject to Yamato Group health insurance |
| Including dependents | 85.3 | 87.4 | 88.5 | 88.4 | 88.9 | ||
| Ratio of completing specific health guidance (%) *3 | Employees only | 85.1 | 76 | 92.0 | 92.2 | 90.6 | Companies/offices subject to Yamato Group health insurance |
| Including dependents | 80.8 | 72.6 | 86.4 | 86.7 | 86.3 | ||
| Ratio of employees recieving breast cancer screenings *4 | Number of locations served by health checkup bus (locations) | 174 | 177 | 172 | 169 | 176 | Companies/offices subject to Yamato Group health insurance |
| Number of employees taking check-up (total of bus and hospital) | 14,247 | 16,814 | 17,224 | 16,347 | 15,914 | ||
| Check-up ratio (total of bus and hospital) | 44.7 | 50.8 | 50.8 | 48.6 | 49 | ||
| Health management certification system (companies with health declaration) *5 | Number of companies with health declaration (companies) | 19 | 13 | 12 | 12 | 11 | Companies/offices subject to Yamato Group health insurance |
| Number of companies with gold certification | 3 | 3 | 3 | 3 | 2 | ||
| Number of companies with silver certification | 13 | 9 | 6 | 6 | 6 | ||
*1 Incident involving a fatality
*2 An indicator that expresses the frequency of industrial accidents, based on the number of casualties due to industrial accidents per million hours worked. Number of casualties due to industrial accidents requiring leave of absence of one day or more ÷ actual total number of hours worked × 1,000,000. The average value for the transportation and postal industry in the 2021 industrial accident trend survey conducted by the Ministry of Health, Labour and Welfare (MHLW) was 3.31.
*3 Employees aged 35 or above, dependents aged 40 or above are subject to the health check
*4 Total number of female employees aged 30 or above who took the health check at the bus or hospital
*5 Conducted by the Health Management Declaration Tokyo Promotion Committee
| Item | Employees subject to training | FY2019 | FY2020 | FY2021 | FY2022 | FY2023 | Scope |
|---|---|---|---|---|---|---|---|
| Occupational health and safety *1 | All employees | - | - | - | 18,793 | 64,489 | Consolidated Group companies in Japan and Swan Co., Ltd. |
*1 Implemented for all employees based on their position, including new employees, personnel responsible for overseeing different areas, and managers
| Item | Details | FY2019 | FY2020 | FY2021 | FY2022 | FY2023 | Scope |
|---|---|---|---|---|---|---|---|
| Number of serious traffic accidents *1 | 2 | 4 | 0 | 0 | 0 | Consolidated Group companies in Japan and Swan Co., Ltd. | |
| Number of safety experts | 413 | 408 | 368 | 358 | 369 | Consolidated Group companies in Japan | |
| Number of employees certified as professional safety experts | STEP 1 (laws and regulations) | - | - | 335 | 305 | 329 | Yamato Transport Co., Ltd. |
| STEP 2 (driving technique) | - | - | 258 | 286 | 326 | ||
| STEP 3 (observation skills) | - | - | 156 | 284 | 309 | ||
| STEP 4 (guidance skills) | - | - | 55 | 190 | 304 | ||
| Number of long-running no accident commendation awardees (persons) | Yamato Transport Co., Ltd. *2 | 9,974 | 11,291 | 14,291 | 10,678 | 11,037 | - |
| Okinawa Yamato Co., Ltd. *3 | 108 | 127 | 106 | 60 | 133 | ||
| Yamato Multi Charter Co., Ltd. *4 | 53 | 51 | 53 | 61 | 50 | ||
| Yamato Box Charter *5 | 412 | 211 | 210 | 65 | 58 | ||
| Rate of reduction in number of traffic accidents (with physical injury) (compared with FY2019) | - | - | 27.1 | 16.3 | 26.3 | Consolidated Group companies in Japan | |
*1 Traffic accidents leading to fatality (in which the employee is the responsible party). Reviewed the scope and recalculated the data for 2015~2017.
*2 Number of years or distance travelled without an accident: 25 years or 2.7mm km (Diamond), 18 years or 1.9mm km (Gold), 8 years or 800,000 km (Silver), 5 years or 500,000 km (Bronze), 2yrs or 200,000 km (Safety Driver Award). Includes part timers from FY2018.
*3 Number of years without accident: 2, 5, 8, 18, 25 years
*4 Number of years without accident: 5, 10, 15, 20, 25, 30, 35 years
*5 Number of years without accident: 2, 5 years
Information Security Data
| Item | FY2019 | FY2020 | FY2021 | FY2022 | FY2023 | Scope |
|---|---|---|---|---|---|---|
| Number of serious information security incidents | - | - | 0 | 0 | 0 | Consolidated Group companies in Japan and Swan Co., Ltd. |
| Information security education implementation rate (%) | - | - | 100 | 100 | 100 | Consolidated Group companies in Japan |
Corporate Citizenship Activities Data
| Item | Details | FY2019 | FY2020 | FY2021 | FY2022 | FY2023 | Scope |
|---|---|---|---|---|---|---|---|
| Amount spent on social contribution activities (JPY MM) | Total | 673 | 402 | 573 | 323 | 458 | Yamato Holdings Co., Ltd. and Yamato Transport Co., Ltd. |
| Out of which, amount donated *1 | 386 | 170 | 409 | 100 | 189 | ||
| Out of which, amount spent on other corporate citizenship activities | 287 | 232 | 164 | 223 | 269 | ||
| Employees who are supporting members of Public Interest Incorporated Foundation "Yamato Welfare Foundation" | Number of employees who are supporting members | 75,158 | 77,674 | 76,004 | 74,371 | 70,641 | Consolidated Group companies in Japan and Swan Co., Ltd. |
| Donations from supporting members (JPY MM) | 73 | 78 | 76 | 75 | 72 | ||
| Music TA-Q-BIN (1986~) |
Number of times implemented | 10 | 5*2 | 4*2 | 4 | 5 | |
| Number of participants | 11,465 | 52,786*2 | 32,417*2 | 4,199 | 6,690 | ||
| Cumulative total number of times implemented | 337 | 342 | 346 | 350 | 355 | ||
| Cumulative total number of participants | 495,631 | 548,417 | 580,834 | 585,033 | 591,723 | ||
| Children's Traffic Safety Workshop (1998~) *3 |
Number of times implemented | 970 | 24 | 0*4 | 72 | 412 | |
| Number of participants | 103,059 | 911 | 0*4 | 6,938 | 40,710 | ||
| Cumulative total number of times implemented | 31,504 | 31,528 | 31,528 | 31,600 | 32,012 | ||
| Cumulative total number of participants | 3,397,793 | 3,398,704 | 3,398,704 | 3,405,642 | 3,446,352 | ||
| Kuroneko Yamato Environment Class (2005~) *3 |
Number of times implemented | 63 | 0*4 | 0*4 | 0*5 | 46 | |
| Number of participants | 9,798 | 0*4 | 0*4 | 0*5 | 2,507 | ||
| Cumulative total number of times implemented | 3,351 | 3,351 | 3,351 | 3,351 | 3,397 | ||
| Cumulative total number of participants | 254,732 | 254,732 | 254,732 | 254,732 | 257,239 |
*1 Community investments through donations to Yamato Welfare Foundation, social welfare organizations, local governments (for disaster reconstruction), and NPO groups
*2 In FY2020 and FY2021, Music TA-Q-BIN (Kuroneko Family Concert) was held online. Numbers of participants were calculated by conversion from number of viewers of live streams, live stream archive videos, and Kanto, Hokkaido, Tohoku and Kansai region archive videos.
*3 as of March end of each fiscal year
*4 Children's Traffic Safety Workshop and Kuroneko Yamato Environmental Classes were suspended as of the end of FY2021 due to COVID-19.
*5 Suspended for renewal
| Item | FY2019 | FY2020 | FY2021 | FY2022 | FY2023 |
|---|---|---|---|---|---|
| Of these, number being implemented * | 343 | 427 | 534 | 626 | 1049 |
| Number of agreements concluded with local governments * | 416 | 499 | 611 | 647 | 675 |
* as of March end of each fiscal year
| Region | Partner | Started in |
|---|---|---|
| Gunma | Shibukawa City, Shibukawa Ikaho Onsen Tourism Assoc., Kanetsu Kotsu | May 2019 |
| Tokyo | Nishi-Tokyo Bus | Nov 2019 |
| Saitama | Kokusai Kogyo | Feb 2020 |
| Miyazaki | Nishimera Village, Sagawa Express, Japan Post, Nippon Koei | March 2020 |
| Hokkaido | Hokkaido Shimukappu Village Bus | July 2020 |
| Gifu | Hachikan Bus Co., Ltd. | July 2020 |
| Nagano | ALPICO Kotsu Co., Ltd. | Nov 2020 |
| Okayama | West Japan Railway Company | July 2021 |
| Kumamoto Prefecture | Kyushu Sanko Bus Co., Ltd. | March 2023 |
| Toyama City | Toyama City | January 2024 |
* Conducted by Yamato Transport (in some cases by Group companies)
Environmental Data
Energy and climate
| Item | FY2019 | FY2020 | FY2021 | FY2022 | FY2023 | |
|---|---|---|---|---|---|---|
| Electricity | From fossil fuel | 5,561,645 | 5,765,487 | 5,213,982 | 4,613,562 | 2,916,069 |
| From renewable energy | 1,858 | 6,972 | 637,189 | 1,281,438 | 2,174,601 | |
| Ratio of power derived from renewable energy | 0.03% | 0.12% | 10.89% | 21.74% | 42.72% | |
| Ratio of power derived from renewable energy (power derived from renewable energy MWh / total power consumption MWh) |
0.09% | 0.18% | 10.94% | 21.75% | 37.25% | |
| Gasoline | Offices | 3,045 | 5,081 | 3,326 | 4,944 | 3,613 |
| Transportation etc. | 520,557 | 660,651 | 633,032 | 610,670 | 559,418 | |
| Kerosene | 59,381 | 51,777 | 50,440 | 39,424 | 35,688 | |
| Diesel oil | Offices | 4,976 | 12,169 | 10,598 | 9,608 | 9,331 |
| Transportation etc. | 7,569,934 | 7,559,904 | 7,545,365 | 7,480,358 | 7,394,517 | |
| Heavy oil A | Offices | 3,754 | 2,822 | 3,097 | 3,220 | 2,520 |
| Transportation etc. | 52,277 | 0 | 0 | 0 | 0 | |
| Liquefied petroleum gases (LPG) | Offices | 38,565 | 32,140 | 15,115 | 15,647 | 15,721 |
| Transportation etc. | 72,175 | 46,063 | 18,624 | 5,003 | 2,211 | |
| Petroleum hydrocarbon gases | 0 | 0 | 0 | 0 | 0 | |
| Liquefied natural gas (LNG) | Offices | 0 | 37 | 38 | 0 | 0 |
| Other flammable natural gases | 0 | 35 | 0 | 0 | 0 | |
| City gas | Offices | 39,468 | 42,511 | 28,593 | 36,667 | 28,170 |
| Transportation etc. | 0 | 5 | 3 | 2 | 1,931 | |
| Hot water | 0 | 0 | 129 | 1,144 | 1,017 | |
| Cold water | 0 | 0 | 165 | 1,435 | 1,715 | |
| Estimated usage volume of energy | 239 | 0 | 0 | 0 | 0 | |
| Energy intensity (GJ/100 million yen of operating revenues) | 734 | 717 | 717 | 720 | 688 | |
| Total (GJ) | 13,927,872 | 14,185,654 | 14,159,696 | 14,103,123 | 13,146,523 | |
| Total (MWh) | 2,889,069 | 2,916,340 | 2,898,582 | 2,874,098 | 2,828,834 | |
- Boundary: Consolidated Group companies in Japan, and Swan Co., Ltd.
- The breakdown may not add up to the total due to rounding.
| Item | FY2019 | FY2020 | FY2021 | FY2022 | FY2023 |
|---|---|---|---|---|---|
| Greenhouse gas emissions | 916,887 | 920,861 | 902,254 | 860,211 | 823,082 |
| Greenhouse gas emission intensity | 48.3 | 46.6 | 45.7 | 43.9 | 43.1 |
- Boundary: Consolidated Group companies in Japan, and Swan Co., Ltd.
- Greenhouse gas emission volume used for calculation of greenhouse gas emission intensity covers Scope1 and Scope2 emissions.
| Item | FY2019 | FY2020 | FY2021 | FY2022 | FY2023 | |
|---|---|---|---|---|---|---|
| Scope1 | CO2 from energy sources | 570,950 | 573,283 | 566,818 | 559,800 | 554,420 |
| CO2 from non-energy sources | 70,525 | 72,163 | 82,581 | 73,923 | 76,489 | |
| CH4 | 2 | 20 | 21 | 33 | 36 | |
| N2O | 0 | 13 | 13 | 0 | 0 | |
| HFCs | 19,715 | 23,061 | 23,765 | 25,766 | 25,773 | |
| SF6* | - | 14 | 14 | 14 | 14 | |
| Subtotal | 661,193 | 668,554 | 673,213 | 659,537 | 656,732 | |
| Scope2 | 255,694 | 252,307 | 229,042 | 200,674 | 166,350 | |
| Subtotal (Scope1 + Scope2) | 916,887 | 920,861 | 902,254 | 860,211 | 823,082 | |
| Scope3 | 1.Purchased Goods and services | 1,192,754 | 1,351,942 | 1,785,484 | 1,804,232 | 1,779,105 |
| 2.Capital goods | 212,525 | 108,001 | 240,534 | 154,002 | 186,390 | |
| 3.Fuel and energy-related activities not included in Scope1 or Scope2 | 141,399 | 139,138 | 136,056 | 133,474 | 133,456 | |
| 4.Upstream transportation, and distribution | N/A | N/A | N/A | N/A | N/A | |
| 5.Waste generated in operations | 3,196 | 3,638 | 2,400 | 2,630 | 2,806 | |
| 6.Business travel | 6,779 | 3,697 | 5,381 | 5,856 | 6,781 | |
| 7.Employee commuting | 41,257 | 47,730 | 54,845 | 54,698 | 54,984 | |
| 8.Upstream leased assets | N/A | N/A | N/A | N/A | N/A | |
| Subtotal (upstream) | 1,597,910 | 1,654,145 | 2,224,700 | 2,154,893 | 2,163,523 | |
| 9.Downstream transportation and distribution | N/A | N/A | N/A | N/A | N/A | |
| 10.Processing of sold products | N/A | N/A | N/A | N/A | N/A | |
| 11.Use of sold products | 118,565 | 96,529 | 72,469 | 60,763 | 54,741 | |
| 12.End-of-life treatment of sold products | 37 | 41 | 37 | 35 | 28 | |
| 13.Downstream leased assets | N/A | N/A | N/A | N/A | N/A | |
| 14.Franchises | N/A | N/A | N/A | N/A | N/A | |
| 15. Investments | N/A | N/A | N/A | N/A | N/A | |
| Subtotal (downstream) | 118,601 | 96,571 | 72,506 | 60,798 | 54,768 | |
| Subtotal (upstream + downstream) | 1,716,512 | 1,750,716 | 2,297,206 | 2,215,691 | 2,218,292 | |
| Total (Scope1 + Scope2 + Scope3) | 2,633,398 | 2,671,577 | 3,199,460 | 3,075,902 | 3,041,374 | |
- Boundary of Scope1 and Scope2: Consolidated Group companies in Japan, and Swan Co., Ltd.
- The breakdown may not add up to the total due to rounding.
* SF6 data has been aggregated since FY2020.
| Businesses | FY2023 |
|---|---|
| Yamato Transport Co., Ltd. | 736,020 |
| Consolidated Group companies in Japan, and Swan Co., Ltd. | 87,062 |
| Total | 823,082 |
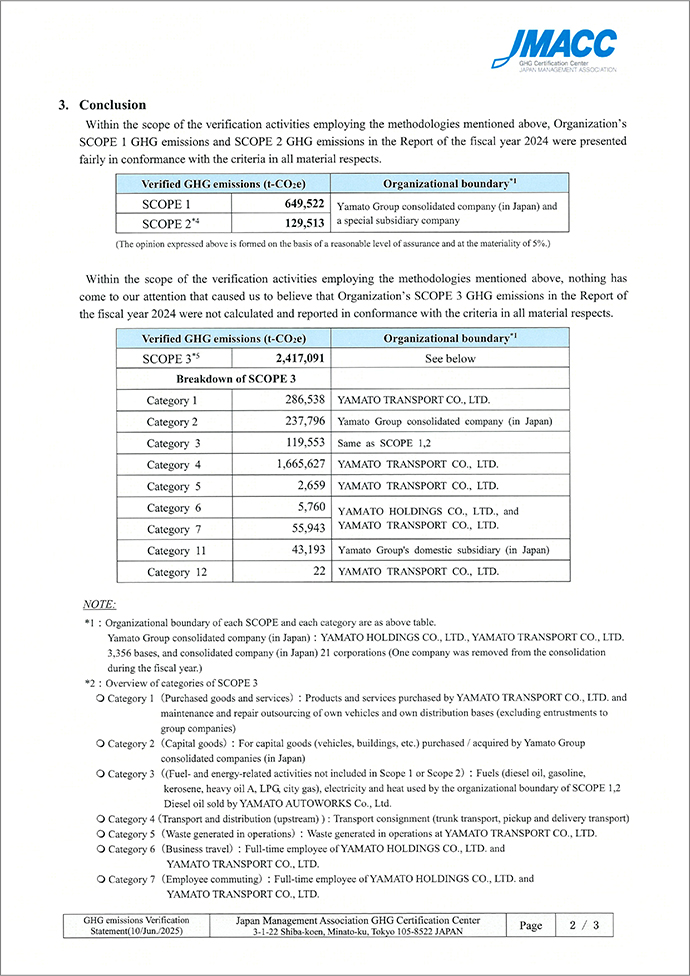
Third-party verification of GHG emissions
Resource conservation and pollution prevention
Materials etc.
| Item | Details | FY2019 | FY2020 | FY2021 | FY2022 | FY2023 | ||||||||||
|---|---|---|---|---|---|---|---|---|---|---|---|---|---|---|---|---|
| Input volume (t) | Recycled input materials (t) | Percentage of recycled input materials (%) | Input volume (t) | Recycled input materials (t) | Percentage of recycled input materials (%) | Input volume (t) | Recycled input materials (t) | Percentage of recycled input materials (%) | Input volume (t) | Recycled input materials (t) | Percentage of recycled input materials (%) | Input volume (t) | Recycled input materials (t) | Percentage of recycled input materials (%) | ||
| Raw materials | Wood, plywood, etc. | 0 | 0 | 0 | 0 | 0 | 0 | 1,013 | 0 | 0 | 0 | 0 | 0 | 0 | 0 | 0 |
| Chemicals | Paint, etc. | 0.1 | - | - | 0.1 | - | - | 0.0 | - | - | 0.0 | - | - | 0.0 | 0.0 | - |
| Auto parts | Vehicle parts | 4 | 0 | 0 | 3 | 0 | 0 | 0 | 0 | - | 0 | 0 | - | 0 | 0 | - |
| Vehicle tyres and tyre tubes | 4,391 | 32 | 1 | 3,709 | 13 | 0 | 3,416 | 6 | 0 | 3,663 | 440 | 12 | 4,065 | 611 | 15 | |
| Vehicles | Car bodies | 18,123 | 33 | 0 | 15,310 | 0 | 0 | 21,379 | 0 | 0 | 6,997 | 0 | 0 | 9,544 | 8 | 0 |
| Sorting equipment | Automatic sorters, belt conveyors | 280 | 0 | 0 | 102 | 0 | 0 | 311 | 1 | 0 | 231 | 0 | 0 | 92 | 0 | 0 |
| Tools and equipment | Roll box pallettes, cold boxes, etc. | 3,235 | 0 | 0 | 4,392 | 0 | 0 | 7,186 | 0 | 0 | 1,359 | 0 | 0 | 10,187 | 0 | 0 |
| Pick-up and delivery equipment | Bags for temperature-controlled deliveries | 116 | 0 | 0 | 125 | 0 | 0 | 131 | 0 | 0 | 109 | 0 | 0 | 149 | 0 | 0 |
| Paper material | Slips | 6,910 | 0 | 0 | 9,084 | 0 | 0 | 9,941 | 0 | 0 | 8,346 | 0 | 0 | 7,409 | 0 | 0 |
| Copy paper | 3,208 | 703 | 22 | 2,701 | 596 | 22 | 3,084 | 1,057 | 34 | 2,905 | 1,876 | 64.6 | 2,516 | 1,691 | 67 | |
| Cardboard boxes for packing | 7,526 | 6,580 | 87 | 15,352 | 12,196 | 79 | 26,251 | 20,411 | 78 | 24,933 | 22,047 | 88.4 | 22,448 | 20,313 | 90 | |
| Material for pick-up and delivery (delivery notices, PP roll paper, etc.) | 2,326 | 0 | 0 | 1,648 | 0 | 0 | 2,123 | 1 | 0 | 2,111 | 0 | 0 | 2,143 | 0 | 0 | |
| Paper materials total | 19,970 | 7,283 | 36 | 28,785 | 12,793 | 44 | 41,399 | 21,468 | 52 | 38,295 | 23,924 | 62.5 | 34,516 | 22,004 | 64 | |
| Containers and packaging material | Packaging material | 2,443 | 7 | 0 | 4,311 | 1,427 | 33 | 3,790 | 1,317 | 35 | 4,043 | 1,275 | 31.5 | 3,347 | 1,146 | 34 |
| Cushioning material | 1,736 | 1,207 | 70 | 1,060 | 259 | 24 | 1,063 | 164 | 15 | 844 | 191 | 22.6 | 796 | 267 | 33 | |
| Bento lunch box containers and bread packaging bags * | - | - | - | 2 | 0 | 0 | 2 | 0 | 0 | 1 | 0 | 0 | 1 | 0 | 0 | |
| Containers and packaging materials total | 4,179 | 1,214 | 29 | 5,372 | 1,686 | 31 | 4,855 | 1,482 | 31 | 4,888 | 1,466 | 30 | 4,144 | 1,412 | 34 | |
- Boundary: Consolidated Group companies in Japan, and Swan Co., Ltd.
- The breakdown may not add up to the total due to rounding.
- *Used at Swan Co., Ltd. Data tabulated since FY2020.
| Item | Details | FY2019 | FY2020 | FY2021 | FY2022 | FY2023 |
|---|---|---|---|---|---|---|
| Furniture | Beds, tables, chairs, etc. | 0 | 0 | 0 | 0 | 0 |
| Packaging material | Styrofoam | 105 | 57 | 36 | 0.7 | 0.8 |
- Boundary: Consolidated Group companies in Japan, and Swan Co., Ltd.
| Item | Boundary · Details | FY2019 | FY2020 | FY2021 | FY2022 | FY2023 |
|---|---|---|---|---|---|---|
| NOx (nitrogen oxide) | Domestic consolidated companies and Swan Co., Ltd. | 608 | 665 | 612 | 512 | 443 |
| Yamato Transport Co., Ltd. | 500 | 501 | 463 | 380 | 326 | |
| SOx (sulphur oxide) | 0 | 0 | 0 | 0 | 0 | |
| PM (particulate matter) | Domestic consolidated companies and Swan Co., Ltd. | 14 | 15 | 14 | 11 | 10 |
| Yamato Transport Co., Ltd. | 12 | 11 | 11 | 9 | 8 | |
| Chemicals | Chemicals other than VOC | 0 | 0 | 0 | 0 | 0 |
| VOC * | 0.92 | 0.92 | 0 | 0 | 0 | |
- Boundary of SOx and chemical substances: Consolidated Group companies in Japan, and Swan Co., Ltd.
*VOC (Volatile Organic Compounds)
| Fiscal year | Item | Hazardous waste (t) | Non-hazardous waste (t) | Total (t) | Percent (%) | Waste volume intensity (t/100 million yen of operating revenues) |
|---|---|---|---|---|---|---|
| FY2019 | Generated volume | 8 | 55,272 | 55,280 | 100 | 2.91 |
| Recycled volume | 4 | 30,478 | 30,481 | 55 | - | |
| Collected volume | 0 | 4,703 | 4,703 | 9 | ||
| Incinerated volume | 4 | 13,501 | 13,505 | 24 | ||
| Final disposal volume | 1 | 6,590 | 6,590 | 12 | ||
| FY2020 | Generated volume | 10 | 48,346 | 48,357 | 100 | 2.45 |
| Recycled volume | 1 | 22,889 | 22,889 | 47 | - | |
| Collected volume | 0 | 4,752 | 4,752 | 10 | ||
| Incinerated volume | 6 | 15,801 | 15,807 | 33 | ||
| Final disposal volume | 3 | 4,905 | 4,908 | 10 | ||
| FY2021 | Generated volume | 16 | 47,775 | 47,791 | 100 | 2.42 |
| Recycled volume | 5 | 21,346 | 21,351 | 45 | - | |
| Collected volume | 0 | 4,637 | 4,637 | 10 | ||
| Incinerated volume | 9 | 16,763 | 16,772 | 35 | ||
| Final disposed volume (landfill) | 1 | 5,030 | 5,031 | 10 | ||
| FY2022 | Generated volume | 12 | 40,259 | 40,271 | 100 | 2.06 |
| Recycled volume | 4 | 18,991 | 18,996 | 48 | - | |
| Collected volume | 1 | 6,958 | 6,959 | 17 | ||
| Incinerated volume | 6 | 11,024 | 11,030 | 28 | ||
| Final disposal volume | 1 | 2,956 | 2,957 | 7 | ||
| FY2023 | Generated volume | 13 | 41,261 | 41,274 | 100 | 2.11 |
| Recycled volume | 4 | 22,949 | 22,953 | 56 | - | |
| Collected volume | 1 | 11,673 | 11,674 | 28 | ||
| Incinerated volume | 6 | 4,354 | 4,360 | 11 | ||
| Final disposal volume | 2 | 2,215 | 2,216 | 5 |
- Boundary: Consolidated Group companies in Japan, and Swan Co., Ltd.
- Hazardous waste refers to "Specially managed waste", designated by Japan's Waste Disposal Law. Non-hazardous waste refers to other waste (industrial waste other than Specially managed waste, general waste, valuables).
- The breakdown may not add up to the total due to rounding
Water and biodiversity
Water
| Item | FY2019 | FY2020 | FY2021 | FY2022 | FY2023 |
|---|---|---|---|---|---|
| Surface water (1,000m3) | 0 | 3 | 13 | 11 | 12 |
| Ground water (1,000m3) | 0 | 9 | 8 | 0 | 0 |
| Rain water (1,000m3) | 0 | 0 | 0 | 0 | 0 |
| Tap water (1,000m3) | 1,787 | 1,679 | 1,809 | 1,553 | 1,479 |
| Total (1,000m3) | 1,787 | 1,691 | 1,831 | 1,564 | 1,491 |
| Reused water (1,000m3) | 1 | 5 | 3 | 3 | 3 |
| Water reuse ratio (%) | 0 | 0 | 0 | 0 | 0 |
| Water consumption intensity (1,000m3 / 100 million yen of operating revenues) |
0.0941 | 0.0855 | 0.0927 | 0.0799 | 0.0781 |
| Item | FY2019 | FY2020 | FY2021 | FY2022 | FY2023 |
|---|---|---|---|---|---|
| Surface water (rivers, lakes, sea) | 0 | 2 | 20 | 10 | 13 |
| Sewage | 1,222 | 1,394 | 1,617 | 1,552 | 1,471 |
| Ground water | 0 | 0 | 2 | 2 | 3 |
| Total | 1,222 | 1,395 | 1,639 | 1,564 | 1,486 |
- Boundary: Water source and water discharge data (FY2020) is for domestic consolidated companies and Swan Co., Ltd. Water discharge data (up to and including FY2019) is for 13 domestic consolidated companies.
- Both water source and water discharge includes estimates.
| FY2019 | FY2020 | FY2021 | FY2022 | FY2023 |
|---|---|---|---|---|
| 0 | 0 | 0 | 0 | 0 |
- Boundary: Consolidated Group companies in Japan, and Swan Co., Ltd.
| FY2019 | FY2020 | FY2021 | FY2022 | FY2023 |
|---|---|---|---|---|
| 2,800 | 2,800 | 2,800 | 2,800 | 2,800 |
- Boundary: Consolidated Group companies in Japan, and Swan Co., Ltd.
Management
| Item | FY2019 | FY2020 | FY2021 | FY2022 | FY2023 |
|---|---|---|---|---|---|
| Violations of environmental laws (incidents) | 0 | 0 | 0 | 0 | 0 |
| Out of which, leakages and pollutions (incidents) | 0 | 0 | 0 | 0 | 0 |
| Fines and penalties (yen) | 0 | 0 | 0 | 0 | 0 |
- Boundary: Consolidated Group companies in Japan, and Swan Co., Ltd.
| Category | Main initiatives | FY2019 | FY2020 | FY2021 | FY2022 | FY2023 | |||||
|---|---|---|---|---|---|---|---|---|---|---|---|
| Investment | Costs | Investment | Costs | Investment | Costs | Investment | Costs | Investment | Costs | ||
| 1.Cost within business area | |||||||||||
| (1) Pollution-prevention cost | Cost for pollution-prevention | 0 | 0 | 0 | 0 | 0 | 0 | 0 | 0 | 0 | 8 |
| (2) Global environmental conservation cost | Low-carbon vehicles (EVs)*1 | - | - | - | - | - | - | - | - | 0 | 810 |
| Exhaust gas regulation-compliant vehicles*2 | 4,802 | 0 | 10,764 | 44 | 13,706 | 24 | 12,720 | 11 | 4,885 | 226 | |
| Low-carbon vehicle peripheral equipment*3 | - | - | - | - | - | - | - | - | 0 | 6 | |
| New electric-assisted bicycles | - | - | - | - | - | - | - | - | 2,829 | 150 | |
| Solar power generation equipment introduction | - | - | - | - | - | - | - | - | 1,744 | 0 | |
| Energy-saving measures*4 | - | - | - | - | - | - | - | - | 1,382 | 69 | |
| Cost for preventing the ozone depletion | 0 | 99 | 0 | 10 | 0 | 6 | 0 | 7 | 0 | 20 | |
| Other global environmental protection | - | - | - | - | - | - | - | - | 0 | 1 | |
| (3) Resource circulation cost | Waste disposal cost | 0 | 700 | 0 | 791 | 0 | 1,541 | 0 | 1,085 | 0 | 3,022 |
| Cost for efficiently using resources | 0 | 3,709 | 0 | 3,979 | 0 | 3,579 | 0 | 3,067 | 6 | 3,563 | |
| 2.Upstream and downstream cost | Green procurement of uniforms*5 | 0 | 523 | 0 | 3,063 | 0 | 1,574 | 0 | 1,081 | 0 | 903 |
| 3.Administration cost | Green procurement and recycling of uniforms and supplies | 0 | 34 | 0 | 202 | 0 | 199 | 0 | 59 | 0 | 193 |
| 4.R&D cost | Costs for research & development | 0 | 0 | 0 | 0 | 0 | 0 | 0 | 0 | 0 | 0 |
| 5.Social activity cost | Hosting environmental classes in each region | 0 | 0.4 | 0 | 0 | 0 | 0 | 0 | 0 | 0 | 9 |
| 6.Environmental remediation cost | Costs to restore damaged environments etc. | 0 | 0 | 0 | 0 | 0 | 0 | 0 | 0 | 0 | 0 |
| Total | 4,802 | 5,066 | 10,764 | 8,089 | 13,706 | 6,923 | 12,720 | 5,310 | 10,847 | 8,980 | |
- Boundary: up to the fiscal year ended March 31, 2023, Yamato Holdings Co., Ltd. and Yamato Transport Co., Ltd.; from the fiscal year ended March 31, 2024, onward, consolidated companies in Japan and Swan Co., Ltd.
*1 Data for fiscal 2023, is for electric vehicles (EVs).
*2 Up to fiscal 2022, EVs and new electric-assisted bicycles are included as vehicles compliant with atmospheric pollution regulations that also have low GHG emissions. From fiscal 2023, only exhaust gas regulation compliant vehicles are included.
*3 In fiscal 2023, EV chargers and introduction of mobile cooling units are included.
*4 Covers introduction of LEDs and measures related to air conditioning efficiency improvement
*5 Repair expenses for roll box pallets and cold boxes, etc., and costs for recycling and water-saving
*6 In-house environmental conservation activities and contributions to groups conducting environmental conservation
| Item | FY2019 | FY2020 | FY2021 | FY2022 | FY2023 |
|---|---|---|---|---|---|
| Waste reduction through improvements (t) | 0 | 0 | 0 | 0 | 0 |
| Reduction in greenhouse gases (emissions) through energy saving (tCO2e) | 30 | 8 | 3,188 | 3,300 | 5,122 |
- Waste reduction refers to the reduction of waste paper, from initiatives to use less paper (digitization of documents) (Yamato Management Service Co., Ltd.)
- Reduction in greenhouse gases (emissions) through energy saving include the effects of introducing automated air conditioning control systems in FY2018 and FY2019 (Yamato System Development Co., Ltd.), and LED lighting in buildings in FY2020 (Yamato Transport Co., Ltd.)
- Effects represent the difference with the previous year
Corporate Governance Data
| Item | Details | FY2019 | FY2020 | FY2021 | FY2022 | FY2023 | Scope |
|---|---|---|---|---|---|---|---|
| Number of Directors | Total | 8 | 9 | 9 | 9 | 8 | Yamato Holdings Co., Ltd. |
| Internal | 4 | 4 | 4 | 4 | 3 | ||
| External | 4 | 5 | 5 | 5 | 5 | ||
| Male | 7 | 8 | 8 | 8 | 7 | ||
| Female | 1 | 1 | 1 | 1 | 1 | ||
| Number of Auditors | Total | 4 | 5 | 5 | 5 | 5 | |
| Internal | 2 | 2 | 2 | 2 | 2 | ||
| External | 2 | 3 | 3 | 3 | 3 | ||
| Male | 4 | 5 | 5 | 5 | 5 | ||
| Female | 0 | 0 | 0 | 0 | 0 | ||
| Number of Executive Officers | Total | 16 | 19 | 5 | 3 | 2 | |
| Male | 15 | 18 | 5 | 3 | 2 | ||
| Female | 1 | 1 | 0 | 0 | 0 |
| Position | Name | Attendance of Board meetings*1 | Attendance of Audit Committee | Attendance of Nomination Committee |
|---|---|---|---|---|
| Directors | Yutaka Nagao | 20/20(100%) | - | 10/10(100%) |
| Toshizo Kurisu | 20/20(100%) | - | - | |
| Yasuharu Kosuge | 20/20(100%) | - | - | |
| Kenichi Shibasaki | 5/5(100%)*2 | - | - | |
| Mariko Tokuno | 19/20(95%) | - | 10/10(100%) | |
| Yoichi Kobayashi | 19/20(95%) | - | 9/10(90%) | |
| Shiro Sugata | 20/20(100%) | - | 10/10(100%) | |
| Noriyuki Kuga | 20/20(100%) | - | 10/10(100%) | |
| Charles Yin | 19/20(95%) | - | 10/10(100%) | |
| Auditors | Yoshihiro Kawasaki | 5/5(100%)*2 | 5/5(100%)*2 | - |
| Tsutomu Sasaki | 20/20(100%) | 22/22(100%) | - | |
| Yoshito Shoji | 15/15(100%)*3 | 17/17(100%)*3 | - | |
| Takashi Yamashita | 19/20(95%) | 22/22(100%) | - | |
| Ryuji Matsuda | 20/20(100%) | 22/22(100%) | - | |
| Yoshihide Shimoyama | 20/20(100%) | 22/22(100%) | - |
*1 In addition to the presented number of meetings held, there was one resolution made in writing, deemed to be a resolution of the Board of Directors, in accordance with Article 370 of the Companies Act and Article 27 of the Company’s Articles of Incorporation.
*2 Retired at the end of term of office at the Annual General Meeting of Shareholders held on June 23, 2023.
*3 Appointed Audit & Supervisory Board member at the Annual General Meeting of Shareholders held on June 23, 2023.
| Directors and Audit & Supervisory Board members | Number of eligible directors and Audit & Supervisory Board members | Total compensation and other remuneration | Total by compensation category | Scope |
|---|---|---|---|---|
| Directors | 4 | 290 | 290 | Yamato Holdings Co., Ltd. |
| Outside Directors | 5 | 77 | 77 | |
| Auditors | 3 | 49 | 49 | |
| Outside Auditors | 3 | 33 | 33 |
For details on corporate governance, please refer to the below pages.
| Item | FY2019 | FY2020 | FY2021 | FY2022 | FY2023 | Scope |
|---|---|---|---|---|---|---|
| Compliance and Risk Management Committee (number of times held) | 4 | 4 | 4 | 4 | 4 | Yamato Holdings Co., Ltd. |
| Number of whistleblower reports/consults (reports/consults) *1 | 696 | 827*2 | 634 | 751*3 | 740 | Consolidated Group (worldwide), and Swan Co., Ltd. |
*1 Total of cases raised to the "Compliance & Risk Committee" of Yamato Holdings, to the President, and to external lawyers. Scope was reviewed and recalculated for FY2017.
*2 A temporary COVID-19 Consultation Desk was established to respond to inquiries and consultations regarding matters such as requirements relating to workplace hygiene and compensation for temporary closures, etc., in light of the spread of the COVID-19 pandemic. Activities such as revising compliance declaration posters and holding explanatory briefings for HR personnel in light of the enactment of the so-called Power Harassment Prevention Act led to greater awareness of the internal reporting (whistleblowing) system.
*3 In conjunction with the June 2022 Amendment of the Whistleblower Protection Act, we conducted uniform training for all domestic Group personnel in charge of handling whistleblower cases, ensuring that employees can use the system with peace of mind. We promote the use of this system by raising awareness of the point of contact among employees, as well as rules for protecting whistleblowers, response flow, and examples of use.
Regarding details of cases, approximately 50% were about personal relations, approximately 30% were about labor management, and about 20% were about problems related to the working environment.
| Item | FY2019 | FY2020 | FY2021 | FY2022 | FY2023 | Scope |
|---|---|---|---|---|---|---|
| Political donations (JPY) | 0 | 0 | 0 | 0 | 0 | Yamato Holdings Co., Ltd. |
| Dismissals and penalties resulting from violations of anti-corruption policy | 0 | 0 | 0 | 0 | 0 | Consolidated Group (worldwide) |
| Amount of penalties and punishments from serious incidents of corruption | 0 | 0 | 0 | 0 | 0 | Consolidated Group (worldwide) |
Certifications (As of March 31, 2024)
| Certification | Company name | Acquired in |
|---|---|---|
| JIS Q 9001:2015/ISO 9001:2015 (Quality management system) |
Yamato Transport Co., Ltd. | |
| Matsudo Logistics Center | 1997 | |
| Shin-Tokyo Logistics Center | 2005 | |
| Komaki Logistics Center | 2007 | |
| Kadoma Logistics Center | 2007 | |
| Higashi-Yodogawa Logistics Center | 2007 | |
| Osaka Minato Logistics Center | 2011 | |
| Haneda Logistics Center | 2014 | |
| Ooi Logistics Center | 2005 | |
| Kasukabe Logistics Center | 2021 | |
| Yamato System Development Co., Ltd. | ||
| Toyocho Office | 2006 | |
| Musashi Kosugi Office | 2015 | |
| Kanto System Operations Center | 2015 | |
| Hokkaido System Operations Center | 2015 | |
| Kyushu System Operations Center | 2015 | |
| Head Office (Y Building) | 2016 | |
| Harumi Office (Z Building) | 2016 | |
| Honmachi Office | 2016 | |
| Excellent Safe Driving Business Certification (G-Mark) |
Yamato Transport Co., Ltd. : Certification obtained for 2,489 business locations in fiscal 2023. | 2016 |
| Okinawa Yamato Transport Co., Ltd. : Certification obtained for32 business locations in fiscal 2023. | 2020 | |
| Kobe Yamato Transport Co., Ltd. : Certification obtained for 3 business locations in fiscal 2023. | 2012 | |
| Yamato Multi Charter Co., Ltd. : Certification obtained for 6 business locations in fiscal 2023. | 2009 | |
| Yamato Box Charter Co., Ltd. : Certification obtained for 51 business locations in fiscal 2023. | 2016 | |
| ISO 23412:2020 / JIS Y 23412 (Indirect, temperature-controlled refrigerated delivery services - Land transport of parcels with intermediate transfer) * |
Yamato Transport Co., Ltd. | 2020 |
| Okinawa Yamato Transport Co., Ltd. | 2020 | |
| Yamato Staff Supply Co., Ltd. | 2021 | |
| ISO 23412:2020 | YAMATO LOGISTICS (HK) LTD. | 2021 |
| PAS 2060:2014 (product carbon neutrality) | Yamato Transport Co., Ltd.’s three TA-Q-BIN services (TA-Q-BIN, TA-Q-BIN Compact, and EAZY) | 2023 |
| ISO 14068-1:2023 (product carbon neutrality) | Yamato Transport Co., Ltd.’s three TA-Q-BIN services (TA-Q-BIN, TA-Q-BIN Compact, and EAZY) | 2024 |
*ISO 23412:2020 is an international standard covering small-lot refrigerated delivery services with methods of transportation accompanying unloading and re-loading of packages.
On February 25, 2023, JIS Y 23412 was issued as a national standard for Japan (Japanese Industrial Standards).
| Certification | Company name | Acquired in |
|---|---|---|
| JISQ15001 | Privacy mark * Yamato Contact Service obtained JISQ15001 in 2017 only(Security management system for personal information) |
Yamato System Development Co., Ltd. | 1999 |
| Yamato Credit Finance Co., Ltd. | 2016 | |
| Yamato Contact Service Co., Ltd. * | ||
| Headquarters | 2007 | |
| Tokyo Contact Center | 2015 | |
| Kanto Mother Center | 2014 | |
| Kansai Mother Center | 2015 | |
| Osaka Solution Center | 2015 | |
| ISO27001 (Information security management system) |
Yamato Transport Co., Ltd. | |
| Head Office Information Security Team | 2023 | |
| Gunma Logistics Center | 2024 | |
| Kuki Logistics Center | 2021 | |
| Koto Logistics Center | 2005 | |
| Haneda Logistics Center | 2021 | |
| Haneda Medical center | 2021 | |
| Atsugi Logistics Center | 2021 | |
| Kita Osaka Logistics Center | 2021 | |
| Tokyo Medical Center | 2021 | |
| Kanagawa Logistics Center | 2021 | |
| Kanagawa Medical Center | 2021 | |
| Osaka Minami Logistics Center | 2021 | |
| Tokyo Recall Support Center | 2021 | |
| Extended Warranty Service Center | 2021 | |
| Oi Logistics Center | 2021 | |
| New Tokyo Logistics Center | 2021 | |
| Matsudo Logistics Center | 2021 | |
| Soka Logistics Center | 2021 | |
| Itami Logistics Center | 2021 | |
| Kagawa Logistics Center | 2021 | |
| Tokyo Exhibitions | 2019 | |
| Kyushu branch (fine arts transport) | 2020 | |
| Yamato System Development Co., Ltd. | ||
| Toyocho Office | 2004 | |
| Musashikosugi Office | 2009 | |
| Hokkaido System Operations Center | 2009 | |
| Kanto System Operations Center | 2009 | |
| Kyushu System Operations Center | 2009 | |
| Yamato Contact Service Co., Ltd. | ||
| Headquarters | 2006 | |
| Tokyo Contact Center | 2015 | |
| Kanto Mother Center | 2014 | |
| Kansai Mother Center | 2015 | |
| Osaka Solution Center | 2015 | |
| Yamato Dialog & Media Co.,Ltd | ||
| Head Office | 2023 | |
| ISO20000 (IT service management) |
Yamato System Development Co., Ltd. | |
| Toyocho Office | 2006 | |
| Musashikosugi Office | 2024 | |
| Harumi Office | 2024 | |
| Hokkaido System Operations Center | 2024 | |
| Tohoku System Operations Center | 2024 | |
| Kanto System Operations Center | 2024 | |
| Chubu System Operations Center | 2024 | |
| Kansai System Operations Center | 2024 | |
| Kyushu System Operations Center | 2024 | |
| PCIDSS (Security standard for the credit industry) |
Yamato System Development Co., Ltd. | |
| ShinTokyoIDC | 2011 | |
| Musashikosugi Office | 2011 | |
| Certification | Company name | Acquired in |
|---|---|---|
| ISO14001:2015 (Environmental management system) |
Yamato Transport Co., Ltd. | |
| Headquarters | 2022 | |
| Kita-Tokyo Regional branch | 2022 | |
| Haneda Contract Logistics Center | 2022 | |